
This is the “newest” version of a paper and script I originally wrote as part of my SANS gold paper for the GCCC certification. The paper re-write was primarily in preparation for my presentation of the topic at the 2016 Nagios World Conference… Unfortunately, the conference was canceled. <sigh> Nonetheless, the paper now covers version 6 of the Critical Security Controls instead of 5.1.
Changelog
6October2015 – Originally posted
16October2016 – Updated for version 6 of CSCs
The original paper in PDF format can still be retrieved from the SANS Reading Room. If you have never visited the SANS Reading Room, I would strongly urge you to do so. There are many really great papers regarding a ridiculously wide-range of security topics.
https://www.sans.org/reading-room/
If you are here simply to get a copy of the check_ioc.ps1 PowerShell script associated with the paper, you can find it at the Github link below. I’ve been told folks use the script as a standalone for incident response and based on that feedback, it helps them out. That’s great! There’s no reason you need to implement the beginning to end automated solution I describe in the solution to get some use from it. If you happen to think of other event IDs that should be added, by all means please let me know via Twitter and I will get them added. I’ve made a few minor updates to the PowerShell script since the original version. The most notable changes now include some points from Dave Kennedy (@hackingdave) on reliably detecting pass-the-hash and Jessica Payne (@jepayneMSFT) on event IDs indicating code has been loaded into the LSA or SAM that is watching for password changes. Including those folks does not mean they endorse this solution in any way, but rather I’m simply giving credit where credit is due and their work helped me.
https://github.com/oneoffdallas/check_ioc
The original script and paper would not be possible without the inspiration and fantastic legwork by some very smart folks at the NSA. If this topic interests you I would highly recommend reading the Spotting the Adversary whitepaper, which is now in version 2. It is a great technical read for both red and blue teams in my opinion. Blue can learn what indicators they should be looking for while red can try to find ways to avoid “tripping” any potential indicators. In addition, it covers Windows Event Forwarding (WEF), aka Windows Collector, in detail down to the setup and configuration. As a result, I do not cover it in the paper although it is obviously recommended for log integrity. In that scenario, the script/solution could then be run on the collector system instead of each individual system.
If you are unfamiliar with the Critical Security Controls, go download the latest version as well as the associated metrics at the Center for Internet Security website. I cannot say enough good things about the CSCs and I believe they should be the foundation of every security program regardless of organizational size. I cannot count the number of security conversations I’ve started based solely on someone’s interest in the prioritization of the CSCs.
Uncovering Indicators of Compromise (IoC)
Using PowerShell, Event Logs, and Nagios
Abstract
What security concerns keep you up at night? Is it pivoting, persistent access, the time to detect compromise, or one of a thousand other possibilities? What if you were told that without a doubt, you have tools at your disposal to periodically verify your security posture and you are not presently using them? Why spend more hours and more budget implementing a new product with new agents and new headaches that will not effectively reduce your workload or anxiety level? Even if you have commercial tools already monitoring your systems for security events, how do you know they are working? Is it even practical to use a customized PowerShell scripts/plugins, built-in event logs, and a traditional monitoring tool such as Nagios to monitor for indicators of compromise on Windows systems? In addition, you will be presented with some applied research as well as easy-to-follow guidelines you can integrate into your own environment(s).
1. Introduction
Your systems are talking, but are you listening? There are indicators of compromise (IoC) in standard “off the shelf” monitoring systems that may provide possible symptoms. The problem is none of them are absolute signs of malicious activity and they do not necessarily throw up alarms clearly stating, “You have been hacked.” For example, 1) a compromised system used to host cracked applications or even movies might fill up a drive partition, 2) uncommon programs taxing the system and causing uncommonly high CPU or memory usage, 3) hung applications or services crashing that previously hummed along for years without issue, 4) logs with numerous warnings and errors in recent history, or 5) unexpected system reboots. How many of us have seen or heard of administrators who simply expanded the drive space, added memory or processors, or simply restarted services rather than digging in to determine the root cause? Maybe the administrator did not have time or maybe they were tasked with keeping the systems up and running, i.e. they did not know what to look for beyond basic stability? Whatever the reasoning, the other key component in all of these scenarios is the system administrator must have the understanding of what normal is in order to determine what is abnormal. Furthermore, they must have previously setup monitoring for “ordinary” and understood the day-to-day nuances of the system rather than struggling to learn on the fly when any semblance of normal has been tossed out the window. Perhaps a system is writing an error to an event log every 5 minutes. Did it start displaying that behavior yesterday, a month ago, or since the day it was installed? The bottom line is the administrator must have knowledge of the system and know whether the currently exhibited behavior displayed by the system or application is normal.
There are a number of systems that provide standard monitoring metrics in a nice, neat, and concise package. It is important to understand that with some event correlation, many standard system baselines — CPU, memory, hard drive, errors/warnings — may very well point us in that direction. However, this is not going to be a discussion over the aforementioned possible indicators of compromise regardless of how invaluable they may be in a root cause investigation. I am going to dig into the act of monitoring for what are more often than not, absolute indicators of compromise. Although there will invariably be false positives if the environment or system is unknown, at the very least all of these suspect events should be investigated with a watchful eye. While this could be used as a standalone solution, this solution would likely better serve as a “checks and balances” detection solution. For example, how does one know Splunk is catching relevant logged events and alerting? It is fairly common practice to utilize a vulnerability scanning engine such as Nessus to double-check patch management or a WSUS implementation. Similarly, a monitoring system with a bit of tweaking can absolutely double-check for meaningful security events to assist in recognizing compromised systems. Also worth noting, this does not way eliminate or alleviate the need for centralized log management. In fact, log management and centralized collection actually yields benefits far beyond simply identifying the occurrence of an attack. While the techniques covered may determine if someone is trying to cover their tracks or set up a persistent backdoor, centralized log management allows the admin to see what activity took place prior to the log clears. In many cases, centralized logging will also help lead an incident handling team to the original entry point where the attacker gained access to the system(s). Last but not least, centralized log management may help significantly with event correlation between disparate systems. For example, a new Windows service was created on this server and then another, similar service was created on an unrelated server. Was there expected maintenance on those systems? Can one tie this activity back to a change control request? Is it malicious?
Before jumping into the monitoring system and accompanying script, there is one important question often asked… “Why not focus on mitigating the attacks rather than after the fact?” As today’s systems and networks grow more complex, it inevitably becomes more difficult to protect and defend them. Some would argue the sheer notion of attempting to prevent all attacks is an agonizing lesson in futility. “Prevention is ideal, but detection is a must.” This phrase has become a tenant of information security, but what does it mean? The best illustration of this concept in an easily explainable format may be found in a recent Mandiant Threat Report (Mandiant, 2015). Based on the data gathered across multiple industries, only 31% of breaches were detected internally. With only 31% detected internally, that means a staggering 69% of breach notifications were a result of external parties — the FBI, other companies, ISPs, auditors, etc. (Figure 1). In addition, the median time to detect compromise was over 200 days with the longest presence of compromise over 8 years (Figure 2). Clearly, preventing these breaches would have been preferred. However, early detection and appropriate countermeasures absolutely would have minimized the damage experienced by these organizations as well as limited the amount of sensitive data lost.
|
Figure 1: Breach Detection |
Figure 2: Discovery Time |


2. What is Nagios?
The monitoring tool I integrated my script and this general technique with is Nagios. This particular integration takes place with the Nagios XI server, although integrating with the Nagios Core product would work as well because the agent is available on both of them. According to the Nagios website, “Nagios is a powerful monitoring system that enables organizations to identify and resolve IT infrastructure problems before they affect critical business processes” (“About Nagios,” 2015). Nagios is essentially a way to monitor nearly every aspect of a computing environment.
Nagios is built on a client-server architecture. This architecture allows the Nagios server processes to communicate directly with the clients regardless of whether the interaction is passive or active. In some cases, the communication channel is an agent built-in to the system such as SNMP or even SSH. In these instances, no additional software is necessary and only minor configuration changes are needed to allow the flow of communication. Other times, a software agent must be installed to give the system administrator added functionality beyond the information standardly received from a native and/or “basic” client. The client may be a Linux system, a Windows server, a router, a switch, etc. Regardless of the means of communication, the Nagios server runs a user defined set of checks against the client system. These checks can vary wildly in their capability from simply pinging a host to testing VPN connectivity. Typically, Nagios and similar monitoring tools are utilized for testing the stability and overall performance of systems and networks. For example, on a standard server, Nagios might monitor for running services or processes, a lack of hard space (Figure 3), or too much CPU or memory usage. On a network device, it may monitor for interface link utilization and whether links are up or down. The types of devices Nagios can monitor and the level of monitoring is quite substantial; in fact, one could argue that depending on the skillset of the implementer, the device list and level of detail is endless.
Figure 3: Example Nagios Disk Usage

For the purpose of this paper, the Nagios NCPA agent is used exclusively. Even if one is familiar with Nagios, one may or may not be familiar with the NCPA agent as there are a number of agents available beyond even the base ones previously mentioned. So what is the NCPA agent? The acronym NCPA stands for Nagios Cross Platform Agent. The agent was designed to “maintain cross-platform servitude” and also as “an abstraction between the sysadmin and the system” (Introduction — NCPA). How the NCPA client fits into the Nagios architecture is represented in Figure 4. The NCPA script on the server calls the NCPA client, which in turn runs the individual desired checks on the system and returns the appropriate value(s). The original NCPA script call on the server specifies (whether by default or user-supplied parameters) whether a returned value is within tolerance. Going back to the graphical representation in Figure 3, if the disk usage is greater than 90%, the system might report back an error if it is above the defined threshold. In this case, since disk usage is less than 90%, the system would report back a status of “OK”.
Figure 4: Standard NCPA Agent

The NCPA agent was selected as a component of this security monitoring solution [over other possibilities] for a number of reasons. First and foremost, it is cross-platform as the acronym implies; it can be installed for Windows, Linux, and Macintosh with identical API calls. While cross-platform is not a necessary requirement for this security-focused integration, it is essential to a more holistic strategy in any environment. Second, all traffic to and from the NCPA client is encrypted. Once again, encryption is not necessarily a requirement for our needs, but rather a must for protecting both internal and external network data. Lastly, NCPA allows for easy integration of numerous scripting languages including Visual Basic, PowerShell, shell and many more. For this reason alone, NCPA is the perfect choice to mesh Nagios and any desired checks.
The script-friendliness of NCPA and the general flexibility of scripting really allow for limitless possibilities. Fortunately, integrating a custom script into Nagios via the NCPA agent is extremely straightforward. For example, to add a PowerShell script so NCPA can call it, simply place the script in the appropriate directory; on a standard Windows install, the full path for the plugins directory is %programfiles%\Nagios\NCPA\plugins. The addition of a PowerShell script into Nagios is a rather simple change to the overall NCPA design. In fact, the only real change (red box) is the addition of the script itself (Figure 5). Absolutely nothing more is required to get a script working on the client side. On the server side, simply configure the server check to call the name of the script, e.g. script.ps1. Those few, uncomplicated steps are how easy it is to get a PowerShell script working in Nagios. Though it will not be discussed further here, it is worth mentioning that after a script is verified as working, there are additional changes that can and should be made for enhanced security. For improved security, PowerShell script(s) should get signed and also have “-ExecutionPolicy Bypass” removed from the ncpa.cfg file, which is added by default. These two changes simply ensure no one can modify the script once it is in place and use a script for nefarious purposes.
Figure 5: NCPA Agent with PowerShell

3. Spotting the Adversary
Much of this work is based on a wonderfully concise whitepaper from the NSA titled, Spotting the Adversary with Windows Event Log Monitoring. According to the document author(s), “Windows includes monitoring and logging capabilities and logs data for many activities occurring within the operating system. The vast number of events which can be logged does not make it easy for an administrator to identify specific important events. This document defines a recommended set of events to collect and review on a frequent basis.” (National Security Agency, 2013). As one might expect, the whitepaper goes into a fair level of detail on various Windows events and even outlines the importance of why various events are significant. These events are easily discovered by searching for the specified event IDs within the Windows Event Viewer or even the XML filter query, which is built into every modern Windows installation. Although there is no need to re-hash the whitepaper in its entirety, the following is a quick rundown of some of the more advantageous checks assuming their usage and subsequent value in one’s environment.
3.1. New Windows Services
Why is there a new service on that system? Is the new service related to new, authorized application someone forgot to perform change control on? Or is it a persistent backdoor? Windows Services are a great way to create persistence because the functionality is built-in to the operating system. One can easily add a new, “automatic” service from a command line in seconds so when the system is booted, the service and associated program are started. However, locating new services is as easy as searching for event ID 7045 in the System event log.
Searching for added services also provides a number of other benefits that might not be as obvious at first glance. The Sysinternals tool, psexec, creates a service and leaves the service behind after doing so. Of course it writes a log entry when it runs, but what about other means of exploitation? The Metasploit module also named psexec is a well-known means of pivoting in a Windows environment. Although the service is deleted immediately execution (Figure 6), the exploit still leaves a log entry when the service is initially created (Figure 7).
Figure 6: Metasploit psexec

Figure 7: Service Log Entry Created by Metasploit psexec

3.2. Windows Firewall Modifications
Even in the most basic form, host-based firewalls can point to possible issues. If the default Windows Firewall is utilized, one can easily check for event IDs 2004, 2005, and 2006/2033; those event IDs represent firewall rule adds, changes, and deletes respectively. Monitoring for these changes is vital to the overall integrity of a system. An attacker will often make modifications to allow persistent tools a means of inbound or outbound communication. Even if the Windows Firewall is turned off entirely or disabled for any single profile, an event is still logged (Figure 88).
Figure 8: Disabled Firewall

3.3. Event Log Clears
Other event types worth monitoring are related to event log clears. To check for System log clears, look for event ID 104. Meanwhile, to check for Audit log event clears, instead look for event ID 1102. Also, clearing the Application log puts nothing in the actual Application event log. However, clearing the Application log does write an entry to the System log and this event ID was previously mentioned.
Granted, the act of log clearing may not always result from malicious intent, but it should be considered a non-standard event that warrants closer examination. When log clears are performed in conjunction with other events, it is obviously a great way for an attacker to cover their tracks. This is especially true in cases where previous “acts” included creating services, changing firewall rules, etc. In some cases, if a system is functioning on an island without log forwarding or any other outside communication, this singular event might be the only indication of a much larger issue.
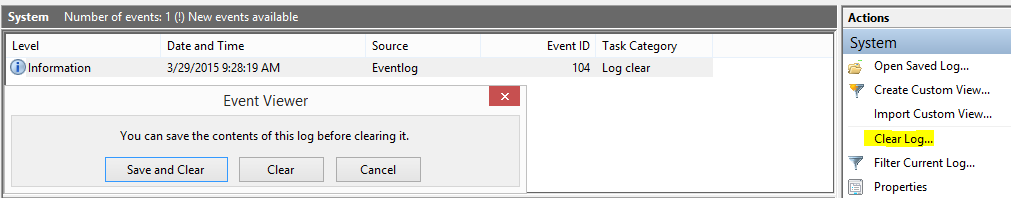
There are several ways to clear out log files. How do they work and more importantly, will standard log monitoring detect them? Naturally, using the Windows native method of clearing event logs (Figure 9) is going to generate the event IDs described above. Event ID 104 is created as expected when clearing out the System log.
Figure 9: Standard Log Clear
What about some not-so-standard methods of clearing the event logs? Clearing the logs via PowerShell (Figure 10), WMIC (Figure 11), or even a non-Microsoft program like clearlogs.exe (Figure 12) all produced the same results. Regardless of what method was chosen, all of them wrote a “log clear” entry as expected.
Figure 10: PowerShell Log Clear Entry

Figure 11: WMIC Log Clear Entry

Figure 12: Clearlogs.exe Log Clear Entry

The list of significant events to possible look for based the NSA whitepaper is quite large and only a handful of them were covered in the examples above. In fact, there are a number of pertinent log events that may prove more useful than the ones described above depending on the environment. For example, what if an organization uses Microsoft EMET (Enhanced Mitigation Experience Toolkit) or Microsoft AppLocker? If so, there are event IDs specific to those applications. Would it be useful to know if an application was blocked by AppLocker? Maybe the blocks point to a malicious application trying to break out of the confines of AppLocker? What if a server that rarely, if ever, has applications installed (or removed) beyond Windows Updates? Then it is painless to search for the event IDs associated with new MSI installs, new application installs, or even anytime an application is updated or removed.
It is also important to note that some of the event log searches may yield false indicators. This goes back to the underlying importance of setting up monitoring when the system is “known good” rather than after thoughts of a possible compromise. For example, the queries specified in the NSA whitepaper for pass-the-hash events are somewhat incomplete. While both successful and failed pass-the-hash (PtH) events are detected (Figure 13), some Remote Desktop and RemoteApp events create identical PtH-identified events when tested in several production environments. My independently discovered false positives for PtH seem to coincide with a BlackHat paper from 2014 where the authors state, “Our conclusion after studying this data (and exploring a great many failed assertions) was that detecting the characteristics of stolen credentials in use requires context around typical behavior in an environment than simple rules-based alerting can provide” (Hathaway & Myers, 2014). Dave Kennedy performed some additional analysis of PtH and its relation to event ID 4624. He discovered the inclusion “Key Length: 0” significantly improved the detection of PtH (Kennedy, 2016). My testing in live environments discovered his findings to be true as it removed the extraneous false positives associated with RemoteApp and Remote Desktop.
How about searching for changes related to another persistent access favorite such as scheduled tasks? Scheduled are easily found (Figure 14), however, to avoid false positives the implementer will need to disable all jobs related to the Microsoft Windows Application Experience as well as the Customer Experience Improvement Program. If not, scheduled tasks modified throughout the day will generate false positives as the scheduled jobs run. How about account lockouts? If the number of “invalid password attempts to lockout” group policy is set low enough and a helpdesk already receives plenty of support calls about locked accounts, then it is strongly advised to make changes before relying on that particular metric as an unconditional indicator of compromise.
Figure 13: Successful PtH Log Entry

Figure 14: Scheduled Tasks Log Entry

4. Automate, Automate, Automate
While the work in the NSA whitepaper is superb, it would require a fleet of support personnel to painstakingly comb through all of the logs manually. Even if someone created and saved filters as custom views it would still be extremely tedious. What if this process could be automated? The possibility of automating these checks was the initial thought and foundation for the entire project. A secondary goal was the concept of using a tool traditionally meant for stability monitoring and re-tool it to monitor for security events. This, in essence, would combine the functionality of a NOC (network operations center) with the functionality of a SOC (security operations center). Is there really that much of a fundamental difference between an alert for a router link dropping and a system alert for the installation of a new or questionable service?
As it turns out, the act of combining the two was greatly simplified because of two important factors. As previously discussed, adding a PowerShell script to the Nagios NCPA client is trivial. As trivial as it may seem, without that capability, the project would have required a drastic course correction assuming it still would have been feasible from a time standpoint. Second, Microsoft has greatly enhanced the power of the command line with PowerShell. The functionality of PowerShell has expanded more and more over the years as it has transformed into its own, full-fledged scripting language with numerous native features. One of the built-in capabilities added in later versions is the “Get-WinEvent” cmdlet; this cmdlet allows for quickly searching and parsing the Windows event logs. With the number of filters used in the various queries, the Get-WinEvent cmdlet offers significant speed improvements over the Get-EventLog cmdlet (Berry, 2011). Get-WinEvent is actually enough of a gain in speed that during testing, the usage of Get-EventLog would not even have been sufficient to return values back to Nagios in a timely fashion.
So the goal was to create an easy-to-use, security-driven PowerShell script that anyone could read through and make modifications to with the eventual goal of Nagios integration for the purpose of automation. The script was named “check_ioc.ps1” to fall in line with the general naming convention of Nagios scripts and those found on Nagios Exchange. Throughout its design, the NSA whitepaper was heavily referenced. In fact, even the “selectable” options in the script point back to the corresponding section in the NSA whitepaper. For example, the option to enable checks for successful pass-the-hash events is aptly named “SuccessfulPtHCheck.” Shortly after the variable is set for the check (0 for disable or 1 for enable) there is a “4.15” reference in the comments (Figure 15); furthermore, going back to the NSA whitepaper, section 4.15 is titled “Pass the Hash Detection.” This allows the implementer to easily reference additional documentation for details about a check if necessary. In addition, other than a few exceptions, all of the event IDs discussed in the NSA whitepaper are available in the check_ioc.ps1 PowerShell script as a selectable option.
Figure 15: Successful Pass-The-Hash Check

5. Mapping Controls to Script Checks
The Critical Security Controls are a well-known methodology for prioritizing various components of security maintained by the Center for Internet Security. At the time of this paper, the Critical Security Controls are at version 6. The purpose of the Critical Security Controls is to “focus on the most fundamental and valuable actions that every organization should take” (Center for Internet Security, 2015). While not all of the checks from the check_ioc script translate to a specific control, a significant number of them do. In fact, many of the checks discussed in the NSA whitepaper and implemented in the PowerShell script have a direct relationship to the Critical Security Controls (Table 1). In a quick rundown of the controls, one could easily argue a minimum of seven Critical Security Controls are either bolstered or nearly satisfied by implementing the script and various “checks” in an environment.
Table 1: Critical Security Controls Relationships
| CSC | Title | Relevant checks |
| 2 | Inventory of Authorized and Unauthorized Software | AppLockerBlockCheck
AppLockerWarningCheck MSIInstallCheck AppInstallCheck |
| 5 | Controlled Use of Administrative Privileges | UserAddPrivGroupCheck
SecEnabledGroupModCheck |
| 6 | Maintenance, Monitoring, and Analysis of Audit Logs | Overall |
| 8 | Malware Defenses | EMETCheck
Various Kernel Driver Signing Checks Various Persistence Checks |
| 9 | Limitation and Control of Network Ports | FirewallRuleModCheck |
| 16 | Account Monitoring and Control | FailedUserAccountLoginCheck
AccountLockoutCheck |
| 19 | Incident Response and Management | Overall |
5.1. Critical Security Control #2 – Software Inventory
Critical Security Control #2 handles the inventory of authorized and unauthorized software. The control specifically mentions application whitelisting and monitoring for the installation of unauthorized software. AppLocker is an application whitelisting technology developed by Microsoft and if implemented, writes event log entries whenever a warning or block occurs. Why is this important? Similar to monitoring or auditing access log files for user login attempts, what does the last failed entry mean? Does the last failed entry mean the attacker gave up trying to access the system? Or does it mean they were successful in their very next attempt, i.e. no point into continuing to try if access was gained? In the same manner, a successful bypass of application whitelisting technology is often preceded by at least one or more failed attempts. For this reason alone, failed or blocked application executions should be monitored closely. It is also worth noting that other industry leading application whitelisting technologies such as those provided by Bit9 write to the event logs as well. As a result, checks for Bit9 or any other technology could easily be added to the PowerShell script for the purpose of automation in lieu of using AppLocker (and related checks).
To further assist with software inventory, why not look for new application installs? On a deployed and stable server, it is normal to see a new application installed on a regular basis? Granted, this check alone will not detect every application executed, however, it will quickly and easily find any new applications installed. Going back to the point made on another check, at the very least a new application install [and alert] should merit an additional level of scrutiny. The relevant check_ioc configuration variable for testing this is called AppInstallCheck. On Windows 8 and newer systems, the MSIInstallCheck variable should be used instead as the event IDs associated with AppInstallCheck have been removed.
5.2. Critical Security Controls #5 and #16 – User Accounts
Multiple controls reference user accounts, user account privileges, and administrative groups. Critical Security Control #5 deals specifically with the limitation of administrative privileges while Critical Security Control #16 is focused account monitoring and control. By limiting administrative privileges, one can often slow down or thwart attackers and malware alike from escalating and performing additional damage. In many cases, a limited user account (non-admin) can mitigate an attack entirely by itself. Therefore, any changes to privileges or additional privileges should be monitored as it could be the sign of a malicious attack. At the very least, it is a way to prevent a future attack. The UserAddPrivGroupCheck tests for any user additions to privileged groups at the active directory level while the SecEnabledGroupModCheck test checks for somewhat similar functionality at the local, system level.
Critical Security Control #16 handles accounts monitoring and control. While the necessary registry or group policy changes must be made before the script is even capable of monitoring, it can assist tremendously after doing so. For example, assume user account lockouts are configured to lockout the user for 15 minutes after 25 failed attempts. Is a normal user going to fail logging in 25 times in a row? Stereotypically, the only instance this might occur is if a client (such as an email client) is set to login automatically and the end user recently changed their password. Despite the possibility for the occasional false positive, receiving an alert for a locked account is essential to the Critical Security Controls as well as the security of any environment. But what happens in the same scenario with an attacker using password spraying techniques, i.e. they are only attempting 20 password attempts at a time on each of the 500 users in the environment? In this example, the account lockout would never trigger if there is enough time in between subsequent rounds of attempts on any particular user. For this reason, there is a separate check called FailedUserAccountLoginCheck. The corresponding variable to this check is FailedUserAcctThreshold and it requires some knowledge of the various systems in order to be “sized” appropriately. Maybe an environment never sees more than 100 failed user account logins for the specified time period? By setting the threshold variable to 100, the prior example would have triggered an alert because it resulted in 1000 total failed attempts (500 users X 20 password attempts).
5.3. Critical Security Control #8 – Malware
Malware defenses appear in Critical Security Control #8. The use of Enhanced Mitigation Experience Toolkit (EMET) is characterized as a “Quick Win” in the Critical Security Controls under section 8-4 (Center for Internet Security, 2015). Furthermore, checking the Windows event logs for EMET related entries can help identify possible spear phishing attempts as well as other exploits successfully mitigated by the toolkit. A number of checks in the check_ioc script test for Kernel driver signing. These are also used to detect malicious or malware activity. Any alteration of a kernel driver should prompt immediate follow-up as this is non-standard behavior and is likely an indication of compromise.
The next step after successful exploitation for any attacker or malware is typically directed at gaining persistence. Why go through the trouble of getting entry to a system only to have someone reboot it and all of the prior work to be lost? Persistence is the foothold that allows the attacker continued access to a system after successive reboots or when any other changes are made. Fortunately, there are a limited number of ways attackers (or malware) typically maintain control of a system. As described earlier, if persistence is achieved through the creation of a new service, a log entry is written and subsequently checked for by the script. Several registry keys are often modified as a way to have a malicious application automatically start each time during boot or logon. With a few changes (described in the next section), one can easily keep an eye on the registry keys in question. Last but not least, malicious applications will often write an entry to any number of standard file locations so Windows auto-starts the application on boot or logon. Much in the way registry keys can be monitored for changes, files and folders can go through a similar process, which is built into the check_ioc script.
5.4. Critical Security Control #9 – Network Ports
The limitation and control of network ports, protocols, and services is included in Critical Security Control #9. This control discusses the need for host-based firewalls and the necessity for said firewall to drop any traffic that is not explicitly allowed (Center for Internet Security, 2015). While the built-in Windows Firewall does not default to deny outbound traffic, it does explicitly deny all inbound traffic when it is enabled. In addition, the behavior for outbound traffic can be altered rather easily with readily available documentation. After the required changes are made to deny outbound communication, firewall modifications are absolutely essential to allow communication on any port or program not already allowed. Any changes then become simple to identify because Microsoft logs all additions, modifications, or deletions of Windows Firewall rules to the event viewer. The FirewallRuleModCheck in the check_ioc script tests for any firewall related changes to the system.
5.5. Critical Security Controls #6 and #19 – Overall
The final two controls covered by the implementation of the check_ioc script are #6 and #19. Critical Security Control #6 is the maintenance, monitoring, and analysis of audit logs, which is the fundamental basis for the script. In fact, one could argue the script improves on some of the control recommendations because it automates a fair amount of searching for anomalies. While the solution is not an all-encompassing log review of every device, any level of automation should be welcomed and viewed as a step toward improvement. Last but not least, incident response and management is represented in Critical Security Control #19. While the automated solution does not lend itself to incident response whatsoever, the script may be used as a quick and easy tool for the incident response team to determine what changed on any previously unmonitored system.
6. Getting Started and Implementation
Before going any further, we will need to do a little housekeeping to ensure the data we are looking for is written to the event logs. Several of the IoC checks require audit policies enabled on the monitored machine in order to work properly. To modify these policies for a local machine, follow the steps below.
- Click Start, click Run, type “gpedit.msc” and hit Enter
- On the left hand side, navigate to Local Computer Policy > Computer Configuration > Windows Settings > Security Settings > Local Policies > Audit Policy
- On the right hand side, double-click “Audit logon events”
- Place a check-box in the “Success” and “Failure” boxes and click “OK” (Figure 168)
- On the right-hand side, double-click “Audit object access”
- Place a check-box in the “Success” and “Failure” boxes and click “OK” (Figure 179)
| Figure 16: Audit Logon Events
|
Figure 17: Audit Object Access
|


These changes add numerous security related events to the Windows Event Logs. For more details on what the changes made here specifically entail, please refer to their respective section in the Appendix for additional information from Microsoft.
If the audit object access is enable to allow for monitoring files or registry keys, some secondary settings must be configured as well. A common attack method for gaining a permanent foothold into a system is adding a persistent backdoor via one of the standard startup registry keys specified by Microsoft (Understand and Control…). To monitor these for changes, the implementer will need to follow the steps below for each of the “Standard Persistent Registry Key” entries found in the Appendix.
- Click Start, click Run, type “regedit” and hit Enter
- Navigate to the key, right-click on it and go to Permissions”
- Click on “Advanced” (Figure 188)
- Go to the “Auditing” tab and click “Add” (Figure 18)
- Select “Everyone” as the principal and change “Type” to “All” (Figure 19)
- Change the “Advanced permissions” as seen in Figure 199
- Click “OK” multiple times to get back to the base Registry Editor screen
Figure 18: Changing Registry Key Audit Level (1 of 2)

Figure 19: Changing Registry Key Audit Level (2 of 2)

With the Windows housekeeping out of the way, we can move onto the PowerShell script itself. The script is freely downloadable on GitHub. It is now open source software distributed under the GPL licensing structure. The easiest method to get the file for usage is by simply going to the link below and then clicking on the check_ioc.ps1 file listed there.
https://github.com/oneoffdallas/check_ioc
Once the file is downloaded, open it using the text editor of choice. There are quite a few “selectable” options in the PowerShell script and it is important to remember to reference the NSA whitepaper if any additional information is needed on a particular check. Although it may take a little extra time during implementation, it is highly recommended all options are scrutinized to determine which ones make sense in the chosen environment; investing time during the setup phase will absolutely save time later and it will also help familiarity with the various options. The latter option will also provide value if and when there are changes in the environment. For example, although the environment may not have AppLocker currently configured, what about a year from now when it is rolled out company-wide? Keep in mind, several indicators are enabled out of the box to begin with. However, that should not prevent the implementer from enabling/disabling as appropriate to match the specific needs of a specific environment. Once completed, simply save the file.
Once all of the necessary changes are made, the script is ready for execution. It should initially run from the command line to ensure it works as expected before integrating it with Nagios or another monitoring engine. One can also easily specify a longer “check” timeframe at the command line to identify if false positives exist and eliminate them. If the script is run without any modifications (and it does not trigger any alerts), the output should look similar to the following:
PS > .\check_ioc.ps1
OK: SuccessfulPtH:0 FailedPtH:0 LogClear:0 FirewallRuleMod:0 ServiceAdd:0 FailedUserAcctLogin below threshold:0 InvalidImageHashFile:0 InvalidPageHashFile:0 FailedKernelDriver:0 RegKeyMod:0 in the last 30 minutes
So what does the output mean? By default, the script is checking for Windows event log entries in the last 30 minutes related to 1) successful pass-the-hash, 2) failed pass-the-hash, 3) event log clears, 4) Windows firewall rule modifications, 5) added Windows services, 6) failed user account logins above a specified threshold, 7) invalid image hash files, 8) invalid page hash files, 9) failed kernel drivers, and 10) registry key modifications on configured keys. In this example, all of the checks came back with values of 0 so an alert was not triggered and instead a value of “OK” was returned.
Once the client-side configuration is complete, the only remaining configuration is on the server side of Nagios. If the NCPA python script (check_ncpa.py) is already downloaded and the Nagios command is working on the server, the next step is to configure the host service check. In the case of Nagios XI, the following line should be copied to the $ARG1$ text box.
-t ‘<token>’ -P <port number> -M ‘agent/plugin/check_ioc.ps1/<ArgLastMinutes>’
This is located within the Core Config Manager under the individual service and the “Service Management” section. Obviously, the token, port number, and ArgLastMinutes should all be filled in with the appropriate values for an environment. The full command-line when re-configuring the service from the main interface will look similar to the following assuming the check command “check_xi_ncpa_agent” is aliased to “$USER1$/check_ncpa.py -H $HOSTADDRESS$ $ARG1$”.
check_xi_ncpa_agent!-t ‘mytoken’ -P 5693 -M ‘agent/plugin/check_ioc.ps1/30’
The “-M” is the path to the script on the client with the main application directory as the working directory. If any issues are discovered at this point, it is worth mentioning the setup can easily get tested via any browser using a string such as https://<HostIPAddress>:5693/api/agent/plugin/check_ioc.ps1/30 and manually inputting the authentication token.
After saving the configuration changes, the next time the newly installed indicators of compromise service check runs, it will provide a service detail view similar to Figure 20. What happens if someone triggers an IoC such as clearing the security log? If any of the indicators are triggered, a critical error is placed on the screen (Figure 21). In addition, the actual log entry is recorded below it. This allows for a quick view of the event log viewer and what caused the alarm without actually logging into the server. Also, depending on how the Nagios server is configured, any number of emails, SMS messages, etc. might be sent to alert someone regarding the issue.
Figure 20: Nagios – No IoC

Figure 21: Nagios – IoC (Log Clear)

7. Conclusion
Doing security well has become increasingly difficult as our environments continue to grow more complex. At the same time, the desire to be connected has never been greater than it is now. As a result, breaches will continue to happen. The next evolution in security must be the realization that prevention is not the only need in a good security plan. While prevention should continue to receive a majority of our focus, supplying little to no resources to detection can only be described as poor planning. By monitoring our internal networks for known attack vectors or methods of persistence an attacker might utilize, we can begin to swing the pendulum back to the side of the defense and continue improving the resiliency of our networks.
The Critical Security Controls should be referenced regardless of the size of an organization. They can serve as a basis for any security program in any industry. While the controls are far from perfect, they can significantly enhance the security of any environment when properly consulted and followed. Although the check_ioc script and interrelated infrastructure only cover a small subset of the Critical Security Controls and security measures necessary to keep information secure, it can greatly improve security when customized appropriately for an organization.
Is there a need for yet another security tool such as check_ioc? Often times, more products and complexity are part of the problem rather than part of the answer. Many organizations have SIEM solutions, next generation firewalls, and numerous other security products already in place, yet they continue to experience breaches. If the solutions are not the issue, then maybe the problem is shaping those solutions to meet the needs of our environments. More importantly, why not integrate existing solutions into our networks and use existing tools wherever possible? That is why the check_ioc script was needed and developed. It was designed as a simple, yet effective tool to assist network defenders in detecting indicators of compromise using products many organizations already have in place. Is the check_ioc script meant to eliminate existing tools? Perhaps it could, but not necessarily. Instead, it was meant as another layer in the defense-in-depth approach, which is mandatory for the sustainability and security of any organization in the network age.
References
About Nagios. Retrieved May 3, 2015, from http://www.nagios.org/about
Berry, M. (2011, April 1). PowerShell: Get-WinEvent vs. Get-EventLog. Retrieved July 1, 2015, from http://www.mcbsys.com/blog/2011/04/powershell-get-winevent-vs-get-eventlog/
Center for Internet Security. (October 2015). The Critical Security Controls for Effective Cyber Defense: Version 6.0. Retrieved from http://www.cisecurity.org/critical-controls.cfm
Hathaway, M., & Myers, J. (August 2014). Black Hat USA 2014: Why You Need to Detect More Than PtH. Retrieved from https://www.blackhat.com/docs/us-14/materials/us-14-Hathaway-Why-You-Need-To-Detect-More-Than-PtH-WP.pdf
Introduction — NCPA 1.8.0 documentation. (n.d.). Retrieved from https://assets.nagios.com/downloads/ncpa/docs/html/introduction.html#what-is-ncpa
Kennedy, Dave. (October 2016). Reliably Detecting Pass the Hash Through Event Log Analysis. Retrieved from https://www.binarydefense.com/bds/reliably-detecting-pass-the-hash-through-event-log-analysis
Mandiant. Mandiant M-Trends: A View From The Front Lines. (n.d.). Retrieved from
https://www2.fireeye.com/rs/fireye/images/rpt-m-trends-2015.pdf
National Security Agency. (2013, December 16). Spotting the Adversary with Windows Event Log Monitoring. Retrieved from https://www.nsa.gov/ia/_files/app/spotting_the_adversary_with_windows_event_log_monitoring.pdf
Understand and Control Startup Apps with the System Configuration Utility. (n.d.). Retrieved from https://technet.microsoft.com/en-us/magazine/ee851671.aspx
Windows Security Log Encyclopedia. (n.d.). Retrieved from https://www.ultimatewindowssecurity.com/securitylog/encyclopedia/Default.aspx
Appendix
Audit logon events
This security setting determines whether the OS audits each instance of a user attempting to log on to or to log off to this computer.
Log off events are generated whenever a logged on user account’s logon session is terminated. If this policy setting is defined, the administrator can specify whether to audit only successes, only failures, both successes and failures, or to not audit these events at all (i.e. neither successes nor failures).
Default values on Client editions:
Logon: Success
Logoff: Success
Account Lockout: Success
IPsec Main Mode: No Auditing
IPsec Quick Mode: No Auditing
IPsec Extended Mode: No Auditing
Special Logon: Success
Other Logon/Logoff Events: No Auditing
Network Policy Server: Success, Failure
Default values on Server editions:
Logon: Success, Failure
Logoff: Success
Account Lockout: Success
IPsec Main Mode: No Auditing
IPsec Quick Mode: No Auditing
IPsec Extended Mode: No Auditing
Special Logon: Success
Other Logon/Logoff Events: No Auditing
Network Policy Server: Success, Failure
Important: For more control over auditing policies, use the settings in the Advanced Audit Policy Configuration node. For more information about Advanced Audit Policy Configuration, see http://go.microsoft.com/fwlink/?LinkId=140969.
Audit object access
This security setting determines whether the OS audits user attempts to access non-Active Directory objects. Audit is only generated for objects that have system access control lists (SACL) specified, and only if the type of access requested (such as Write, Read, or Modify) and the account making the request match the settings in the SACL.
The administrator can specify whether to audit only successes, only failures, both successes and failures, or to not audit these events at all (i.e. neither successes nor failures).
If Success auditing is enabled, an audit entry is generated each time any account successfully accesses a non-Directory object that has a matching SACL specified.
If Failure auditing is enabled, an audit entry is generated each time any user unsuccessfully attempts to access a non-Directory object that has a matching SACL specified.
Note that you can set a SACL on a file system object using the Security tab in that object’s Properties dialog box.
Default: No auditing.
Important: For more control over auditing policies, use the settings in the Advanced Audit Policy Configuration node. For more information about Advanced Audit Policy Configuration, see http://go.microsoft.com/fwlink/?LinkId=140969.
Standard Persistent Registry Keys
HKLM\Software\Microsoft\Windows\CurrentVersion\Run
HKCU\Software\Microsoft\Windows\CurrentVersion\Run
HKCU\Software\Microsoft\Windows NT\CurrentVersion\Windows\Run
HKCU\Software\Microsoft\Windows NT\CurrentVersion\Windows
HKLM\Software\Microsoft\Windows\CurrentVersion\RunOnce
HKCU\Software\Microsoft\Windows\CurrentVersion\RunOnce
* RunonceEx keys no longer exist in Vista and later OSes

Dallas Haselhorst has worked as an IT and information security consultant for over 20 years. During that time, he has owned his own businesses and worked with companies in numerous industries. Dallas holds several industry certifications and when not working or tinkering in tech, he may be found attempting to mold his daughters into card carrying nerds and organizing BSidesKC.
The post Uncovering Indicators of Compromise appeared first on Linux Included.